St. Louis Rams vs. Oakland Raiders Official Game Day thread

  • To unlock all of features of Rams On Demand please take a brief moment to register. Registering is not only quick and easy, it also allows you access to additional features such as live chat, private messaging, and a host of other apps exclusive to Rams On Demand.

RamzFanz

Damnit
Joined
Jun 4, 2013
Messages
9,029
Isn't roughing the passer a classic example of an aggressive penalty? It's a pretty fine line some times. And if you err on the side of being aggressive and beating the crap out of the other team's QB, isn't that generally going to help you win games?

I should have been clearer because it can be both. Sometimes it's just bad luck. Other times it's just being stupid. Especially when it's giving up a 1st down on a play that would have resulted in a punt. Same with off sides. If you're being aggressive and it's working, an off sides now and then is meaningless. If it's just sloppy play, it's very harmful.
 

Rmfnlt

Rams On Demand Sponsor
Joined
Jun 3, 2014
Messages
5,342
I don't mind aggressive penalties, it's the stupid ones that kill the Rams. If your getting unsportsmanlike like or roughing the passer, it needs to be stopped.
Yes, there are timesd when a penalty makes sense.. like holding when a WR has you beaten. But the false starts? Offsides? Those are mental mistakes and - to me - point to coaching and fundamentals. And the Rams are near the top of the league when it comes to those.

Oh, and I think they're at or near the top of the league in personals fouls as well. So, there's that.

Let's face it, there's no amount of spinning that is going to make the Rams penalty situation (be they aggressive... or mental) look like it's OK.

It isn't... and it has to get addressed.
 

Rmfnlt

Rams On Demand Sponsor
Joined
Jun 3, 2014
Messages
5,342
If you're being aggressive and it's working, an off sides now and then is meaningless. If it's just sloppy play, it's very harmful.
Taken as a whole, which category would you say the Rams are in?
 

MrMotes

Starter
Joined
May 6, 2014
Messages
954
I should have been clearer because it can be both. Sometimes it's just bad luck. Other times it's just being stupid. Especially when it's giving up a 1st down on a play that would have resulted in a punt. Same with off sides. If you're being aggressive and it's working, an off sides now and then is meaningless. If it's just sloppy play, it's very harmful.

Well again, teams that commit a lot of penalties have won the last 3 SB's.

IMO, they're simply not the negative fans make them out to be. Penalties aren't always bad and there are other factors that are far more important. Combine those two things, and i come away thinking penalties are pretty close to meaningless...
 

Rmfnlt

Rams On Demand Sponsor
Joined
Jun 3, 2014
Messages
5,342
Well again, teams that commit a lot of penalties have won the last 3 SB's.

IMO, they're simply not the negative fans make them out to be. Penalties aren't always bad and there are other factors that are far more important. Combine those two things, and i come away thinking penalties are pretty close to meaningless...
Well, that's your opinion and you're certainly entitled to it.

But I'd hazard to guess that the majority of Rams fans think otherwise.

Comparing the CURRENT Rams to the last 3 SB contestants is inherently flawed logic IMO.

If the Rams get to the SB this year and lead the legue in penalties, I'll agree with you... until then, nope.
 

V3

Hall of Fame
Joined
Apr 23, 2013
Messages
3,848
I don't mind aggressive penalties, it's the stupid ones that kill the Rams. If your getting unsportsmanlike like or roughing the passer, it needs to be stopped.
Don't forget false starts, delay of game, illegal formation, etc. The kind of mistakes that are purely mental and aren't caused by the other team.
 

V3

Hall of Fame
Joined
Apr 23, 2013
Messages
3,848
Well again, teams that commit a lot of penalties have won the last 3 SB's.

IMO, they're simply not the negative fans make them out to be. Penalties aren't always bad and there are other factors that are far more important. Combine those two things, and i come away thinking penalties are pretty close to meaningless...
They aren't as important for teams that have offenses that can compensate/overcome them. When your offense is built to just hold on to the lead and rely on the strong defense, it can't overcome them. They matter for the Rams, IMO. Especially when the defense isn't on their game. It puts the onus on an offense that isn't built to put up many points or come from behind.
 

RamzFanz

Damnit
Joined
Jun 4, 2013
Messages
9,029
Well again, teams that commit a lot of penalties have won the last 3 SB's.

IMO, they're simply not the negative fans make them out to be. Penalties aren't always bad and there are other factors that are far more important. Combine those two things, and i come away thinking penalties are pretty close to meaningless...

To me that's just too black and white. If a meaningless penalty loses a possession or let's the opponent keep possession, it's as bad as a turnover. If Quinn gets a false start because he's sacking the QB and disrupting the QB all game, so what. I would say it's more the nature and timing of the penalties that determine if they are meaningful or not.
 

Alan

Legend
Joined
Oct 22, 2013
Messages
9,766
MrMotes with this theory:
Well again, teams that commit a lot of penalties have won the last 3 SB's.

IMO, they're simply not the negative fans make them out to be. Penalties aren't always bad and there are other factors that are far more important. Combine those two things, and i come away thinking penalties are pretty close to meaningless...
Correlation does not imply causation. Where is the evidence that the penalties played any positive part in any victories by those teams? Were they successful despite those penalties or because of them. It's counterintuitive to think that negative yardage plays are helpful to your team's success. For good reason IMO. Yeah, there are other factors that are more important and most of them fall into the superior play category. Good/great teams can often overcome negative yardage plays but to claim that they don't make it harder for them to win is unsupported by any facts IMO.

Even the supposedly good penalties such as PI when you're beaten by a WR are suspect. Who's to say the WR was the primary receiver and that the QB was going to throw him the ball in the first place? Who's to say that even had the WR been the primary option that the QB would have made an accurate throw or the WR would have caught the pass or that the pass rush wouldn't have gotten to the QB before he had a chance to see or to throw to that open WR? Yeah, sometimes it might work out well (probably but there's no proof of that) but I see no evidence that a majority of PI penalties by defensive players result in positive outcomes. There isn't even any anecdotal evidence that other penalties have a "positive" effect. That is just a supposition that hasn't been proven. Of course it can't be proven so I'll just go with the math (as always :)) here and say negative yardage is bad, positive yardage is good. Vice versa for the defense.
 

Rmfnlt

Rams On Demand Sponsor
Joined
Jun 3, 2014
Messages
5,342
They aren't as important for teams that have offenses that can compensate/overcome them. When your offense is built to just hold on to the lead and rely on the strong defense, it can't overcome them. They matter for the Rams, IMO. Especially when the defense isn't on their game. It puts the onus on an offense that isn't built to put up many points or come from behind.
When you are using an argument that assumes the 2014/2015 St. Louis Rams are comparable to the last 3 SB participants, I really have to question the validity of the argument.

I agree with what you said 100%!

I'd hate it if Jeff Fisher thought penalties were meaningless. I'd guess he's closer to allowing some.. the ones that:
1] Kill his team's offensive drives
2] Prolong opponents offensive drives
 

MrMotes

Starter
Joined
May 6, 2014
Messages
954
To me that's just too black and white. If a meaningless penalty loses a possession or let's the opponent keep possession, it's as bad as a turnover. If Quinn gets a false start because he's sacking the QB and disrupting the QB all game, so what. I would say it's more the nature and timing of the penalties that determine if they are meaningful or not.

But what if that offsides gives up a crucial first down, or a questionable hit on the QB cost us? I'm saying that in the aggregate, such aggressive play is a net positive, and penalties, in general are not a net negative.

Look at TJ, got the 15 yard personal foul but also had a nice break up and a int. I want him on my team, not the other guy's...
 

MrMotes

Starter
Joined
May 6, 2014
Messages
954
Correlation does not imply causation. Where is the evidence that the penalties played any positive part in any victories by those teams?

That not my argument. I'm saying if penalties were a significant negative (or any kind of negative) we'd see some kind of correlation between penalties and winning and losing. We don't see that. It's because there is no correlation that teams that lead the league in penalties also win Superbowls...
 

Alan

Legend
Joined
Oct 22, 2013
Messages
9,766
MrMotes with this correction of my perception:
That not my argument. I'm saying if penalties were a significant negative (or any kind of negative) we'd see some kind of correlation between penalties and winning and losing. We don't see that. It's because there is no correlation that teams that lead the league in penalties also win Superbowls...
I still have a problem with what you're saying here. Significant? What's your definition of significant?

"We don't see that." Yes we do, you're just not looking in the right place. After every single penalty we see it. When first and ten becomes first and fifteen or first and 5 you see it. It's right there in front of you. Are you saying that it's not harder to make a first down if it's first and 15 versus first and 10 or even better, first and 5? While it would be extremely hard to actually find a direct correlation due to the, as you said earlier, myriad "other factors that are far more important" that doesn't mean that that can't be extrapolated from data that can be directly observed. The old saying that "football is a game of inches" extends beyond actual measurements IMO. One play can mean the difference between winning and losing. How many times have you said "If they'd called that holding penalty on Quinn they wouldn't have completed that pass and scored that TD" or something like it?

Here's a little math (sorry about that) along with some comments to help you take a different look at this problem.

http://archive.advancedfootballanalytics.com/2008/07/first-down-probability.html
First Down Probability
By Brian Burke
For every series beginning with a 1st down and 10 in the NFL, an offense achieves another 1st down (including scoring a TD) 66% of the time. So if an offense is to be graded on a 1st down play, it should at least gain enough yards so that they have at least the same probability of sustaining the drive or scoring. In this article, I’ll begin a discussion of utility in football by examining the break even point in a series of downs. In other words, what would you rather have, a 1st and 10 or 2nd and 7? What about 2nd and 6? 5?

When any team has the ball, it's typically trying to sustain a drive. It would be nice if they threw a 50 yard bomb for a touchdown, but usually their most immediate priority is to retain possession by getting a 1st down. One way to measure a play’s success is by how much it improves or impairs a team’s probability of getting there.

The graph below illustrates the probability of eventually achieving a 1st down in a current series given various ‘to go’ distances on 2nd down and 3rd down. Data is from all regular season plays from 2002 through 2007.

This is a graph that I'm unable to post for some reason.

We can see that the break even point for 2nd down is 5.5 yards. In other words, a team (whose purpose is to get a 1st town) should prefer a 2nd down and 5 to a 1st and 10, but it should prefer a 1st and 10 to 2nd and 6.

For 3rd down, the break even point is at 1.5 yards. A team should prefer a 1st and 10 to any other 3rd down situation 2 yards or longer. This was a little surprising to me. I expected the break even point to be around 3rd and 3 or 4.

We can also compare other situations. Consider a team with a 2nd and 8. The chance of getting a first down on their current series is 57%. To break even in terms of 1st down probability, they need to gain at least 5 yards to have a 3rd down and 3. In fact, the two probability curves are generally separated by 5 yards, between the usual situation of 10 yards to go and 2 yards to go.

Five yards appears to be the magic number. Unless a team gains 5 or more yards on a given play, it’s a setback in terms of 1st down probability.

Carroll, Parmer, and Thorn, the authors of The Hidden Game of Football, established a measure of football play success in similar terms. In their system, if an offense gains at least 4 yards on 1st down, the play is considered a success. On 2nd down, the play is considered successful if it gains half the remaining distance to the first down marker. And 3rd down is only considered a success if it gains a 1st down. This may sound familiar to some readers because the Football Outsiders blog applies this same system, with limited modifications, in their DVOA scheme.

According to the actual probabilities of gaining a first down, however, this system isn’t always consistent. An offense needs 5 yards on 1st down, not 4, to break even in terms of first down probability. Also, gaining half the yards remaining on 2nd down often leaves a team worse off than it was before the play began.

Getting anything less than a 1st down on 2nd and 4 or less leaves a team with a lower probability. On 2nd down and 7, a team’s chance of getting a 1st down is 62%. Gaining half the remaining yards leaves the offense at 3rd and 3.5 yards, which yields a 1st down 54% of the time. They’d need to be inside 3rd and 2 to break even.

This is only one way to measure success in football. There are others, such asexpected points and win probability. I’ll take a look at those methods in upcoming articles.


published on 7/30/2008

Wednesday, July 30, 2008
Long time lurker. Cool post. I'm somewhat surprised that teams convert greater than 33% of their third downs with more than 10 yards to go and even around 20% with 15 yards to go.

38-40% is about median team 3rd down conversion rate. I'm also curious what the yards to go distribution looks like for each down.

Does the 66% include 1st downs that have less than 10 yards due to penalties?

  • Thursday, July 31, 2008
    Great stuff as usual Brian.
    Is there a significant difference in these stats as you get close to the goal line? Is it harder to make a first down from the opponents 20 than from your own 20 (for example)? It seems like there would be some effect from having less room, and maybe the defense being more intense because you are about to score.
  • Brian Burke says:
    Friday, August 01, 2008
    Yes, the 66% conversion rate includes all penalties. It's for every series of downs excluding those for which time ran out. It also includes red zone series. The rates definitely decline close to the end zone.

    But that could be for at least 2 reasons--a smaller field to defend and the attractiveness of an almost automatic 3 points (or both). Teams likely get cautious throwing the ball knowing that a turnover or sack would almost certainly take away points. The latter effect is especially strong late in close games and would tend to skew the conversion rate.
  • Brian Burke says:
    Friday, August 01, 2008
    One more clarification regarding Dave's comment--It's not that teams convert 33% of their 3rd and 10s. It's that they convert 33% of all series in which they had a 3rd and 10 at some point in the series. So in some cases teams who fail to convert on 3rd and 10 go on to convert on 4th down.
  • Monday, September 01, 2008
    Great post. However, as far as the comment about DVOA, it seems as if this is like comparing apples to oranges. My understanding is that DVOA is a different measure of success. It compares a team's performance in a situation to the average performance across the league (i.e. what do you need to do on down x with y yards to go to perform above average). You're measure of performance (which, IMO is more interesting), is looking at things from a 1st-down perspective. So even if gaining 5 yard on 2nd and 7 doesn't increase expected 1st down rate, it is better than average and in that way it is succesful
  • Brian Burke says:
    Monday, September 01, 2008
    Thanks. According to what I can tell, DVOA is based almost completely on a system published in the 1988 book Hidden Game of Football (p. 69). The system classifies plays from scrimmage as either a "win" or "failure." The authors picked 4 yards for 1st down and 50% to go for 2nd down apparently intuitively. It appears they were pretty close, but I don't think a 4-yd gain on 1st down is can be considered a win because you've actually become slightly less likely to convert the 1st down. Perhaps the numbers looked different in '88, however.

    DVOA does this same thing, then adds modifiers called "success points" (or something similar) to account for excess yards above (or below) what would be classified as a success. Then all the success points are adjusted for opponents, then compared across teams and situations to compute the % over average. So it's the success points above or below average, not yardage itself that goes into DVOA. (At least as far as I can understand.)

    One problem I have with DVOA, and FO in general, is that these formulas and stats are "proprietary," as if they're the formula for Coke or the designs for the stealth bomber. Unless they tell people exactly what they're computing, no one can tell if it's valid or worthwhile.
Math is god Mr. Motes and you should never fuck with god. :LOL:
 
Last edited:

RamzFanz

Damnit
Joined
Jun 4, 2013
Messages
9,029
But what if that offsides gives up a crucial first down, or a questionable hit on the QB cost us? I'm saying that in the aggregate, such aggressive play is a net positive, and penalties, in general are not a net negative.

Look at TJ, got the 15 yard personal foul but also had a nice break up and a int. I want him on my team, not the other guy's...

It seems we basically agree. If it's aggressive play that yields results all game, penalties are the price you pay.

If it's weak and sloppy play all game, penalties just add to the misery and loss. Yes?
 

Alan

Legend
Joined
Oct 22, 2013
Messages
9,766
More math with working graphs:
http://phdfootball.blogspot.com/2014/03/first-down-probability.html
First Down Probability

Abstract
In this post I compute the First Down Probability metric, which predicts how likely a drive will produce at least one more first down for a given down and distance. I find similar overall first down conversion rates to prior studies in the literature, including that third down rushing plays are significantly underutilized. Unlike previous studies, however, I break down these rushing plays by the position of the ballcarrier, and find that a significant portion of this discrepancy comes from rushes by the quarterback, likely from scrambles on broken passing plays. More puzzling is the fact that QB runs on first and second downs don't show this trend, a result that is difficult to convincingly explain.
Introduction
During the course of a football game a fan gets a lot of statistical information. These numbers – QB rating, a running back's average yards per carry, time of possession, etc – generally lack any kind of contextual information about how the game is actually going. At best these statistics are incomplete (showing a WR's average yards per catch after a 99-yard completion, for instance); at worst, they're downright misleading (That QB just had 5 completions in a row...but they were all screens for minimal yardage).

A better statistic is one that takes the game situation into account. For instance, a 5-yard completion should count for more on third and 4 than on third and 16. There are several such statistics already in existence, such as Football Outsider's DVOA metric or Expected Points. These sorts of metrics generally depend on using historical play-by-play data to compute average outcomes for plays at any given down and distance. This approach is (unsurprisingly) more computationally complex, and often can appear opaque to the casual fan. Some of these stats, such as the DVOA, are intricate enough that their creators have decided to keep the full details of their computation private.

A direct and (relatively) simple context-sensitive statistic is Brian Burke's First Down Probability, which I will abbreviate as FDP. That link has more details, but the core insight of this metric is that the average odds of converting the next first down in a series can be estimated for any given down and distance. With this information in hand, it's possible to evaluate the result of a play based on whether it improves or harms the offense's chance of eventually getting a first down.

In this post I'm going to compute the FDP for the plays in the Armchair Analysis database. One may ask why I would recompute this quantity when Burke has already done quite a good job of it. One reason is to ensure the reproducibility of results – while I trust Burke's analysis, everyone makes mistakes. A more basic reason is that while Burke produces a nice visualization of his computed FDP he doesn't provide his data in a tabular form, which makes using his FDP values difficult (at best). I can also extend the FDP calculation to all four downs (Burke only considers second and third downs in his post). Finally, I can (spoiler alert) start using FDP to generate new insights about how teams approach different down-and-distance situations.
Data
As I mentioned before, I'm using the Armchair Analysis database, which covers the 2000-2011 NFL seasons. I grabbed the play-by-play data for all regular season and playoff games, then filtered out plays for several reasons. Plays inside the two minute warnings were discarded because teams play differently in those situations; I removed plays when the game wasn't close (defined as one team being up by more than 16 points) for the same reason. I cut out all punts and field goals as well as penalties (although I keep the results of the penalties in the data: if a team runs for -5 yards on second down but then is the beneficiary of a 15-yard roughing the passer call on third down, the second down play would be considered as ultimately resulting in a first down for the purposes of this analysis). Finally, to avoid biasing the data based on field position I only include plays between the offense's own 10-yard line and the redzone.

Ultimately this results in a dataset of 262,601 plays, split 56%-44% in favor of passes over runs. I bin these plays as a function of current down and yards to go, eliminating bins with fewer than 200 plays in my dataset. This cut ensures that there are no bins with conversion rates dominated by sampling error. The Python script I used to do this data querying and processing (as well as produce the plots in later sections) can be found here.

Results

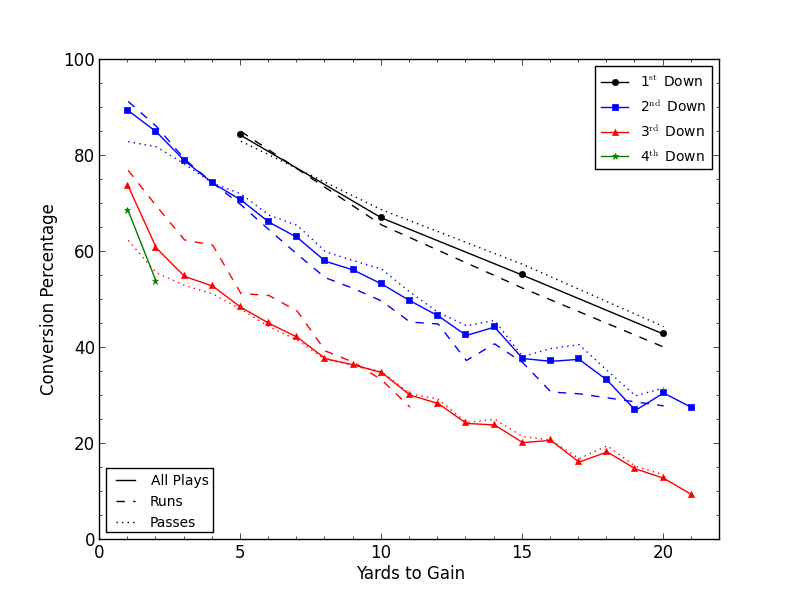
Figure 1: FDP as a function of down and distance. The colors denote different downs, while the line styles break down success if the next play in the drive is a run or a pass. In some cases the data for the individual types of plays does not cover the same range of yards to gain. This is due to the minimum play cutoff detailed in the Data section.
Figure 1 shows the raw results, split by down and distance. For the benefit of anyone looking to check my results or to build on them I have also tabulated these results in text files, which can be obtained from my GitHub repository. Feel free to use them as long as you explain where you got them from (and a link back here would be nice as well!).

Anyway, the first thing to do is to check my results with what Burke obtained. It's a bit difficult to compare directly since I can only eyeball our plots, but in general my results seem to be fairly copacetic with his. The data between downs look fairly similar, with a ~15% shift each down as you go from first and N to second and N, increasing to ~20% from second to third down. There's not much data on fourth down, but I see no reason why it wouldn't resemble the other downs for conversion attempts beyond 2 yards.

More interesting is what happens when you break the conversion percentages down by type of play. Note that when comparing the FDP of runs versus passes at a given down and distance, a higher conversion rate for e.g. a pass doesn't necessarily mean you should always throw the ball in that situation; rather, it implies that currently NFL teams are not playing at the Nash equilibrium. This means that NFL teams should call more passing plays in that situation than they currently do; as defenses adjust to this new reality, there should be more opportunities for successful rushing plays, and eventually the FDP of both types of plays will equalize. Burke has some more detailed discussion of this in hisbreakdown of first down probability for runs and passes (although he restricts his analysis to third downs).

So again we are treading on old ground, and again it makes sense to compare results. Here we find a bit of a discrepancy, with Burke's rushing FDP on third and short ~5% lower than mine. It's not clear why this would be, although it might be due to the fact that Burke's data only goes through the 2007 season or how he considers sacks (the Armchair Analysis database considers sacks to just be really crappy passes). Regardless, things appear similar enough to proceed.

It's clear that teams aren't passing enough on first and second downs with more than 5 yards to go. Considering teams are already passing a lot in those situations, especially in second and 10+, this would imply that even the occasional rush in such circumstances is too much.

In short yardage, however, things are reversed. On second and 3 or less teams are running less often than they 'should', although the difference is only at about 7% or so. Third down is even more striking: whenever there are fewer than 9 yards to go the data indicate that teams should be running more. This is an even larger discrepancy than Burke finds, and is downright shocking given how unusual 7+ yard runs are under normal circumstances.

But there are two kinds of runs – designed runs and aborted passing plays. Burke considers the latter category to be rare enough to be inconsequential, but I wasn't so certain. So I modified my program to separate out rushes by the position of the ballcarrier – it can't tell if a QB rush was designed that way or if it was improvised, but it's better than nothing.

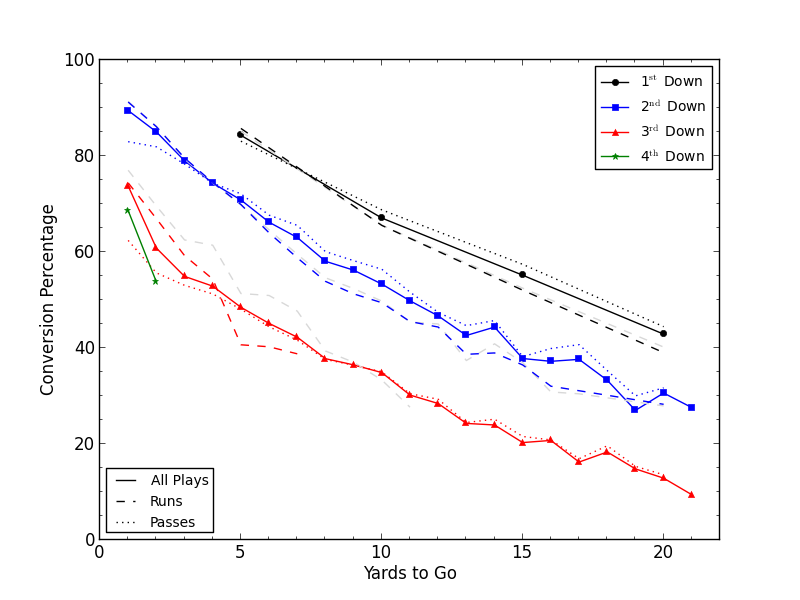
Figure 2: FDP, corrected for the influence of QB runs (the uncorrected rushing percentages are shown in gray to facilitate direct comparison).

Figure 2 shows the result, and it turns out that without the QB involved a third down rush becomes a much worse proposition. Indeed, now teams should only be running more on third and 3 or less, consistent with what the data show for second down.

While teams are generally doing better at finding the equilibrium between passes and rushes with RBs, these results indicate that teams are letting their signal-callers run the ball far too infrequently. If you look at the conversion rates just for QB scrambles it's generally 10% or more higher than a rush from a running back in the same situation! Even more interesting is that this offset only applies on third down. On first and second down a QB scramble appears to have similar conversion rates as a regular rush.
Discussion and Conclusions
First of all, the fact that QB rushes are so underused compared to other types of plays is quite interesting. Given the fact that teams generally do not want their prize passers taking hits down the field, most of these successful conversions are likely due to scrambles on passing attempts. But given how high the conversion rate is perhaps coaches should consider running a few more QB draw plays, especially with all the mobile passers entering the league.

But what's really weird is that QB's rushes aren't more successful than the regular variety on earlier downs. A possible explanation is that defenses are more keyed toward stopping shorter-yardage plays on second down, whereas on third down they sit back and follow the WRs down the field. But in that case you would expect third down rushes to be equally successful, regardless of the runner. I think it's more likely that on second down a QB under pressure isn't concerned with making the sticks, but rather simply looks to get out of trouble. On third down, however, the consequences of playing it safe are much more clear, which encourages passers to scramble for every last yard.

Of course, I'll be the first to admit that this is just speculation. A definitive analysis of this phenomenon would probably require deep analysis of individual quarterback scrambles, which is way beyond the scope of this work. But it is a cool result from a (relatively) simple metric, and illustrates how deep insights can be gleaned from just a little bit of intelligent digging.

I actually periodically read this stuff. :( I have no life. :LOL:
 

MrMotes

Starter
Joined
May 6, 2014
Messages
954
"We don't see that." Yes we do, you're just not looking in the right place. After every single penalty we see it. When first and ten becomes first and fifteen or first and 5 you see it. It's right there in front of you. Are you saying that it's not harder to make a first down if it's first and 15 versus first and 10 or even better, first and 5? While it would be extremely hard to actually find a direct correlation due to the, as you said earlier, myriad "other factors that are far more important" that doesn't mean that that can't be extrapolated from data that can be directly observed. The old saying that "football is a game of inches" extends beyond actual measurements IMO. One play can mean the difference between winning and losing. How many times have you said "If they'd called that holding penalty on Quinn they wouldn't have completed that pass and scored that TD" or something like it?

The goal is to win games and championships. There's simply no correlation between penalties and a team's ability to do those things.

And again, if an Olineman gets away with holding 9/10 times, is that a net positive or should he stop holding because of the lost yardage every 10th time or so?

And if the players who take more penalties also make more big plays, are you better off taking the penalties or sitting the "undisciplined" players?

Maybe there'e s a correlation between penalties and how teams rank on offense and defense by yards, but i doubt that's there either.

If you want to use math, where's the correlation?
 

Mojo Ram

Moderator
Moderator
Joined
Feb 3, 2013
Messages
22,972
Name
mojo
Don't forget false starts, delay of game, illegal formation, etc. The kind of mistakes that are purely mental and aren't caused by the other team.
These are the types of penalties that can no longer be tolerated.
 

Alan

Legend
Joined
Oct 22, 2013
Messages
9,766
MrMotes not convinced:
If you want to use math, where's the correlation?
If you get a penalty it increases the the distance required to get a first down. The longer the distance you have to travel to make a first down the harder it is to do that. The harder it is to get a first down the more often you have to punt. Every possession in which you have to punt is a possession that you didn't score points. The less you score the harder it is to win. If you don't see the correlation (and the math) there I really don't know what else I can say except that I guess we'll just have to agree to disagree about this.
firstdownlikelihood_qbcorr.png