- Joined
- Jun 28, 2010
- Messages
- 48,145
- Name
- Burger man

Nice article here;
<a class="postlink" href="http://bleacherreport.com/articles/1683775-when-does-age-catch-up-to-nfl-players?utm_source=cnn.com&utm_medium=referral&utm_campaign=cnn-sports-bin&hpt=hp_bn15" onclick="window.open(this.href);return false;">http://bleacherreport.com/articles/1683 ... pt=hp_bn15</a>
Old football folks will tell you NFL stands for "Not For Long." With 32 teams fighting for every penny of a multi-billion dollar revenue stream, there's no room for sentiment.
No matter how long a player, coach or staff member has been with an NFL team, if there's even a tiny competitive edge to be found or a handful of change to be saved, anyone can lose their job.
In 2010, Detroit Lions head coach Jim Schwartz so badly wanted defensive end Kyle Vanden Bosch to anchor the Lions defense that Schwartz showed up on Vanden Bosch's doorstep with a bottle of wine, a custom Fathead of Vanden Bosch in a Lions uniform and a $26 million contract.
This spring, the Lions released Vanden Bosch—with a year still left on that contract.
What happened? After 12 seasons in the NFL, age finally caught up with Vanden Bosch, and his production slipped. In the NFL, contracts are for producers.
Nobody seems to know when Father Time comes to rob NFL players of their skills. Some players seem to turn from stars to has-beens overnight, while some walk away from the game with all their powers intact.
When does age catch up to NFL players?
How Long do NFL Careers Last?
To answer that question, we'll have to establish a baseline: how long the average NFL career lasts.
The NFL Players Association pegs that number at 3.5 seasons. During the 2011 lockout, Commissioner Roger Goodell told a group of fans it's "closer to six years," assuming you're only counting players who are on the active roster from the beginning of their career. Goodell said it's more like nine years for first-round draft picks.
To find out when age robs top players of their superlative skills, though, we can't include players who never catch on in the NFL. Nor can we tie skills to draft status; many first-round picks fail and many late-round picks have long careers.
We turn to Pro Football Reference, whose Player-Season Finder tool lets us sort through players, seasons and statistics in nearly every imaginable way.
Let's set the starting point at 1978, the advent of the 16-game season and modern passing rules. By position, let's average out the career length of every player with at least five seasons' worth of starts and drop them into a box-and-whiskers chart:
For each position, the black dots at the top and bottom represent the high and low career length. The top black dot for the wide receiver group, for example, is Jerry Rice.
The orange boxes go from the lower quartile to the upper quartile of the group; half of all starters' career lengths land between the top and bottom of that box. The blue bands behind the yellow boxes represent the overall average for each position, which is written out in black numerals.
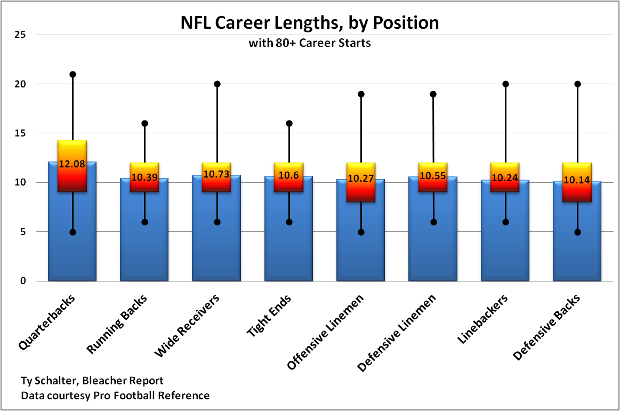
The first thing that stands out is just how similar the overall averages are. Other than the quarterbacks, who averaged 12.08 seasons, every other position's average career is about 10 and a half seasons.
Beyond that, we see how compressed the quartiles and upper bounds are for the running backs, wide receivers and tight ends. Their averages are in line with the rest of the positions, but it's obviously much harder to succeed into your 30s at the so-called skill positions.
That said, the high lower quartile also proves that talented offensive playmakers will get every opportunity. If you're a starting-caliber skill player, it's just as hard to have a short career as an exceptionally long one.
We tend to think of offensive linemen as having very long careers. You never hear draft analysts say "draft him and forget about his position for 10 years" unless they're talking about an offensive lineman.
Yet offensive linemen are tied with defensive backs for the lowest lower quartile in the group. It seems odd, but 25 percent of offensive linemen good enough to start 80 games don't make it past their eighth season.
Now we know how long the careers of NFL starters at every position last. How—and when—do they start to diminish?
Breaking Down Production Over Time
There are a million ways to judge production, but only one gives us a one-number figure that compares across positions, seasons and even decades: Pro Football Reference's Approximate Value.
As explained in the series of posts that link takes you to, AV is one back-of-the-napkin number for a player's total production over a season, adjusted by their share of their team's production. These numbers aren't super precise, just a good rough guess of how productive and valuable a player was in any given season.
For each of the position groups, we can break down average AV for rookies, second-year players, third-year players and so on, giving us a picture of how players at certain positions tend to develop and decline.
Again, let's limit the sample player-seasons to 1978 and after, assuring apples-to-apples season lengths and similar offensive rules. The sets will be limited to players-seasons with at least 14 starts (and qualifying levels of attempts, the ones PFR uses for their rate stat minimums).
For some of the positions with the most variance, I've done the same analysis but with age, as well as years of NFL experience.
Quarterbacks
The quarterback is the most important, most protected position on the field, and it shows. The average starting quarterback plays about two seasons more than the average player at any other position.
Let's look at how quarterbacks develop and decline:
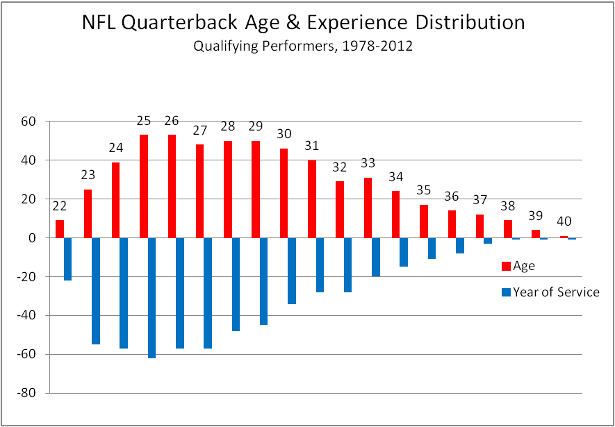
This dramatically shows the late start and slow development of quarterbacks. See how there are zero 22-year-old quarterbacks who've started 14 NFL games since 1978? From 23 to 24, 24 to 25 and 25 to 26, there was a massive leap in understanding with each generation.
At age 25, quarterbacks hit a long plateau; the number of them who start 14-plus games from age 25 to 30 is almost unchanged. The curve stays quite flat on the back end; quarterbacks good enough to be perennial starters have little trouble staying employed.
Is their performance that consistent? Let's check out their average Approximate Values:
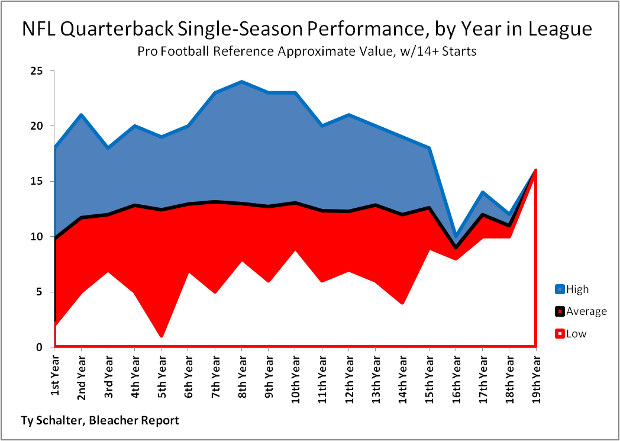
There are a few very interesting things going on here. First, an across-the-board jump from year one to year two; quarterbacks who start both their rookie and sophomore seasons put up a significantly higher peak, average and low AV in their second season.
That low value continues to jump up and down around the number five for most of the rest of the chart; the weird dip in year five is due to an outlier, Ron Jaworski's 1978. He started every game, but produced an AV of only one; the next-lowest value for a fifth-year starter was four.
Peak AV climbs very steadily from year three to year eight; the best quarterbacks get steadily better, even as the average and low values stay flat.
At year 10, there's a significant drop-off in peak AV, then a steady decline to year 15. The average, however, begins to trend upward as the poorer starters stop playing. The elites aren't producing like elites anymore, but they're still very good and make up the majority of quarterbacks with careers that long.
At year 16, it dwindles down to just a handful of quarterbacks, so the peak drops sharply and the floor rises too. The last data point is just Favre being Favre.
What if we look at the same values, but broken down by age? Is there a magic age when quarterbacks get worse?
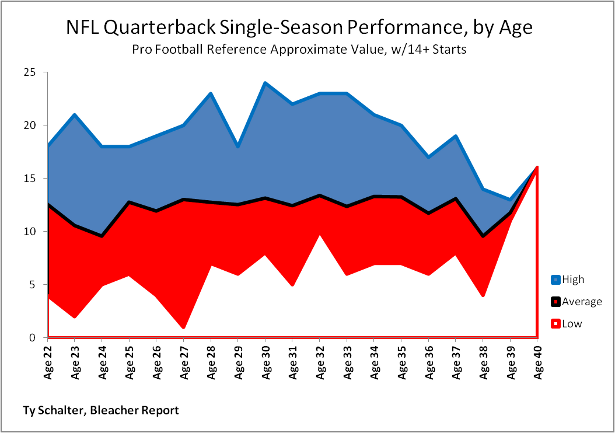
This chart is a lot more volatile. The eye is drawn to the big dip in peak AV at age 29; this appears to just be a weird coincidence and not part of a larger trend (it's surrounded by very high AV values). Look at the jump from age 36 to age 37, though: High, average and low AV all take a big jump up—and then a huge dip. By 40, everyone but Favre is gone.
Running Backs
Running backs, in many ways, are the opposite of quarterbacks. They have much shorter careers, and they—if you'll forgive the joke—hit the ground running:
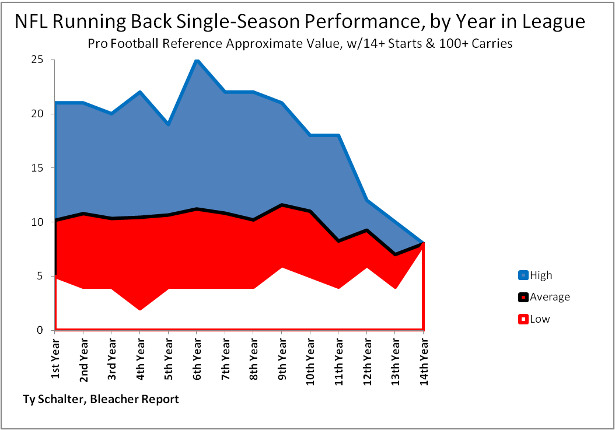
To qualify for this chart, backs had to start 14-plus games and rack up 100 or more carries on the season. That's Pro Football Reference's minimum number to qualify for rate stats.
As rookies, most running backs good enough to start are about as good as they're ever going to get. The top rookie backs are legitimately great, the floor is quite high and the average is right in line with where it'll be for the first seven seasons or so.
From the second year to the fourth year, a gap opens up between the haves and have-nots; the floor declines while the peak climbs. Maximum AV is reached at 26 and stays very high for the next few seasons.
In the eighth season, the high and low hold steady while the average declines; I presume this is because backs are starting to fade and dwindle. In the ninth year, a big jump in the floor and average confirms the poorest starters are gone and only the best producers remain.
Even the elites don't have long after that, though. The top AV value drops like a rock from the ninth year through the 14th, and the average and floor seesaw underneath it. The volatility there comes from the rapid drop-off of qualifying backs:
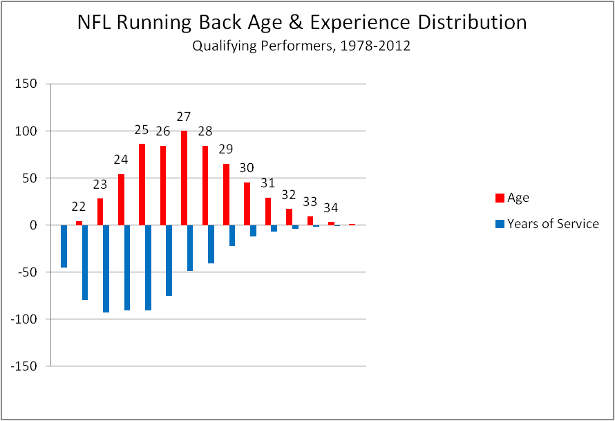
Look at the slow, steady climb of tailbacks who qualify from ages 21 through 25, then the quick, straight drop-off from the high of 27 down to 34. Though we think of quarterback as a "development" position, once quarterbacks have a few years' experience, they're either starters or out.
Running backs not talented enough to start right away, though, spend years getting stronger and waiting for their opportunity. It's too bad that by the time the most backs are starting (age 27), their skills are about to evaporate.
Wide Receivers
We think of receivers as being volatile, but their performance chart is actually one of the most sane and stable:
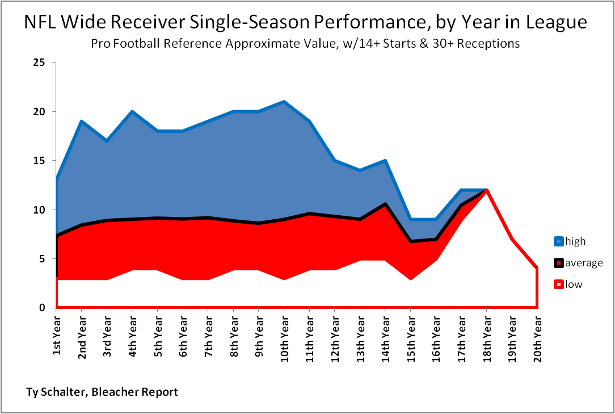
The eerily flat floor, I suspect, is partly due to the minimum qualifications of 14-plus games started and 30 receptions. That said, besides a small jump from year one to year two, the peak and average AV for receivers is basically just as flat.
From year two to year 10, the typical production of starting receivers basically doesn't change. There's an upward trend in the peak AVs, but that's it.
Year 10 begins a steep, steady decline in peak AV and a rise in average AV. This is the same effect we've seen before: Mediocre starters are stop playing, and the remaining elites are showing their age.
From Year 14 on, the small sample size starts making things squirrely. Also, there's the Jerry Rice Effect to contend with: He was so very good for so very long, the last three data points are all him.
If we go by age, the effect is even more pronounced:
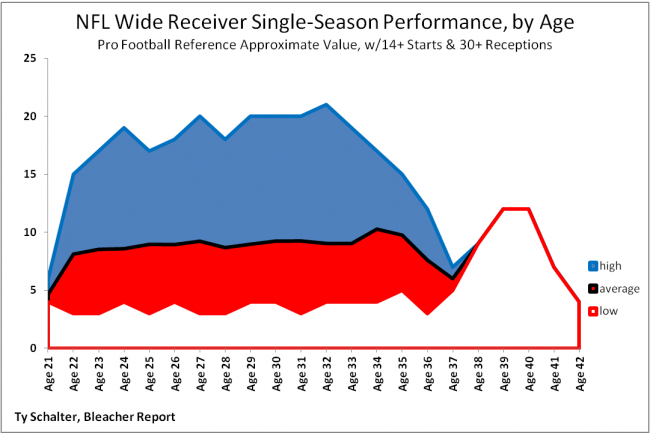
Again, a big jump from year one to year two, then shockingly similar production until top AV peaks at 32 and begins a steep decline. Average AVs get a big bump as the decent starters fall off, but then they decline as well. After age 38, it's all Jerry Rice.
Let's take a quick look at the age distribution:
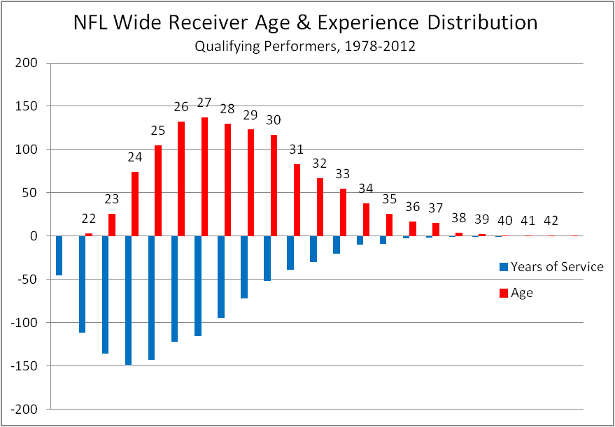
Remember the old saw about receivers taking a big jump in their third year? It's the truth. Even though the receivers good enough to start right away start out at nearly great and climb from there, there's a massive jump in qualifiers from year one to year two, and then from year two to year three.
The ensuing decline is much more gradual with receivers than backs.
Tight Ends
Other than running backs, tight ends have the most brutal performance chart:
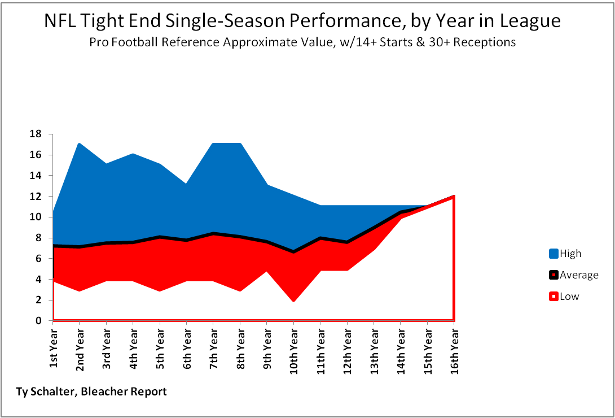
Just like receivers, tight ends have a big jump in high and average AV from year one to year two, and then it's (mostly) flat.
Unlike receivers, though, the peak AV never gets any higher than year two's high-water mark, and there's a big decline in the average from year seven to year 10. By the 10th year, there's an across-the-board dip.
Then, even though high AV stays flat as a board, average and low AV steadily rise to meet it.
My theory here is that all tight ends begin to decline around year seven, but the two-way tight ends really start to go. At year 11, the only ones left are the elite pass-catchers, the ones who've never done much blocking. Their production pushes a dramatic rise in average from year 10 to year 15.
What about age?
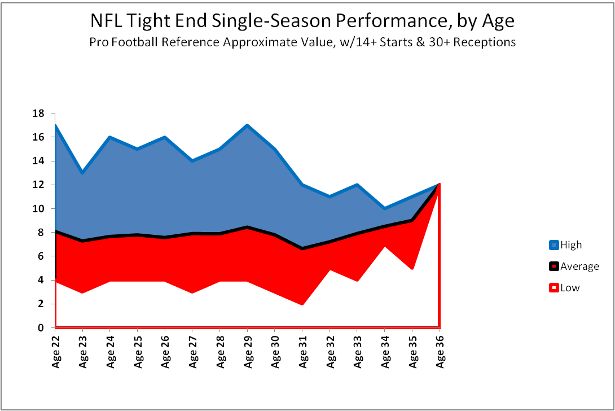
This graph tells much the same story, though it's interesting to note that instead of a big jump from rookie season to second season, there's an across-the-board drop-off from age 22 to 23! The only explanation is that rookie tight ends drafted to start at age 22 are exceptionally athletic pass-catchers, so less-skilled 23-year-olds drag them down.
Here's the age distribution, brutish and short:
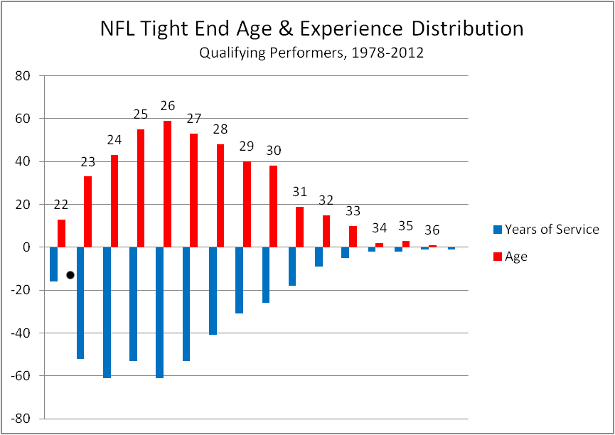
Note the peak qualifier year, age 26, comes earlier than any group we've looked at and tails off resolutely. There's no doubt that tight end is one of the most physically demanding positions.
Offensive Line
We expect offensive linemen to be rocks of consistent production, and they are:
The ruler-straight floor likely has to do with AV's limitations on measuring offensive linemen. If you started 14-plus games there's only so little you can be part of your team's production. Also, it's tempting to say the eerily flat average AV is due to the huge numbers of "offensive linemen" (remember, five start per team), not consistency.
Yet, peak AV moves the way we expect it: a big jump in the second year, a steady climb to year seven, a drop-off to a plateau from year eight to year 12 and then another big drop-off and decline.
Meanwhile, average AV climbs slowly, resolutely upward, peaking in year 11 and then following the big drop-off to year 13. Let's check the experience distribution:
This is classic. A huge jump in qualifying starters from year one to year two, a peak at year four and then an almost-spookily consistent year-over-year decrease in qualifiers until year 15.
As the year-by-year charts have been more useful (and we've charted the more-volatile skill position careers), we'll stop looking for a "magic age" and focus on years of service.
Defensive Line
Though they're counterparts, you can see the increased role athleticism plays in defensive linemen: Peak AV gets higher and faster. There's less volatility in the peak and more volatility in the average, and the production drop-off from year 12 to year 15 is swift and shocking:
The extended line at the end is not one Jerry Rice, but two: Bruce Smith is responsible for the excellent year 17 and year 18 single data points, and Jim Marshall (whose consecutive-games record Brett Favre broke) was still going strong in his 19th and 20th seasons.
Only Marshall's last two years count, though, as they were 1978 and 1979!
Let's look at the experience distribution of qualifiers:
The typically massive jump in starters from year one to year two is even more massive with defensive linemen. The greatest numbers of qualifiers are mostly flat from year three to year six, but years two and seven aren't far off the pace.
After a defensive lineman's seventh year in the NFL, his time is very, very short. Look at the huge drop-off in qualifying starters from year seven to year eight, and from year nine to year 10. The decline flattens for a while, as the best defensive linemen can stick around a very long time, but the quick development, long plateau and quick decline is obvious.
Linebackers
Linebackers have the most pronounced rookie effect of all the positions:
The floor is extremely high; talented linebackers who start as rookies will do very well right away. Even though that floor drops out as a mass of second-year players work their way into the lineup, the development is shocking: peak AV jumps from 17 (Lawrence Taylor) to 22 (Brian Urlacher).
The floor never gets lower than the second season, though. In fact, it slowly climbs for the duration of the chart. Like offensive linemen, the average AV builds slowly but very steadily throughout the first decade of a linebacker's career.
Peak AV is a little odd, though. In the midst of a fairly flat plateau from year two to year eight, there are two big dips at year four and year seven. Year eight's up-tick starts a three-year decline in peak AV, which oddly reverses course for two years before the bottom falls out in year 15.
Linebackers' lone warrior for year 17 and 18? Clay Matthews.
No, not the guy with the Fathead commercial. His dad.
What about experience distribution?
We see a second-to-third year qualifier jump almost as big as the defensive linemen's and a very early peak in year three, which stays very flat for two more seasons. Essentially, if a linebacker isn't starting by year three, he probably never will.
The steady decline in qualifying linebackers after year five, we see, is much more gradual than the brick wall linemen hit.
Defensive Backs
Finally, we have the defensive backs:

Though they have a reputation for being mercurial, they actually have the most dependable, consistent production of any position group. The average AV, incredibly, rises consistently from the first year to the 16th!
The second-highest peak AV any defensive back has recorded came from a rookie: Patrick Peterson's 21 in 2011. Even if we discard it for being inflated by return touchdowns, Ronnie Lott was hot on Peterson's heels with 18.
So, as we can see, top defensive backs produce like top running backs immediately.
From the third year on, peak AV slowly, inexorably declines (save for a massive drop-off and bounce-back between years 12 and 14), while the floor stays flat and the average builds.
What about participation?
Turns out the defensive pattern holds here, too: a few excellent rookie starters, an enormous jump in second-year starters and a peak at year three. Unlike linebackers, though, year three doesn't begin a plateau, it's an actual peak. After year three, the number of defensive backs who start 14-plus games declines quite steadily.
Conclusion
There's no "age of doom" or "season of doom" for NFL players.
From one position to another, there are wildly different career development and production profiles. Even then, there are exceptions to every rule. One or two players at each position have broken all the rules and played at a high level into and beyond the high teens.
Across the board, though, we see that those players good enough to start for five years tend to play about 10 years, and even the best and hardiest lose an obvious step or two after 12 years.
Keep those facts in mind if you're an NFL team with a key veteran going into a contract year—or a diehard fan in the market for a new jersey.
<a class="postlink" href="http://bleacherreport.com/articles/1683775-when-does-age-catch-up-to-nfl-players?utm_source=cnn.com&utm_medium=referral&utm_campaign=cnn-sports-bin&hpt=hp_bn15" onclick="window.open(this.href);return false;">http://bleacherreport.com/articles/1683 ... pt=hp_bn15</a>
Old football folks will tell you NFL stands for "Not For Long." With 32 teams fighting for every penny of a multi-billion dollar revenue stream, there's no room for sentiment.
No matter how long a player, coach or staff member has been with an NFL team, if there's even a tiny competitive edge to be found or a handful of change to be saved, anyone can lose their job.
In 2010, Detroit Lions head coach Jim Schwartz so badly wanted defensive end Kyle Vanden Bosch to anchor the Lions defense that Schwartz showed up on Vanden Bosch's doorstep with a bottle of wine, a custom Fathead of Vanden Bosch in a Lions uniform and a $26 million contract.
This spring, the Lions released Vanden Bosch—with a year still left on that contract.
What happened? After 12 seasons in the NFL, age finally caught up with Vanden Bosch, and his production slipped. In the NFL, contracts are for producers.
Nobody seems to know when Father Time comes to rob NFL players of their skills. Some players seem to turn from stars to has-beens overnight, while some walk away from the game with all their powers intact.
When does age catch up to NFL players?
How Long do NFL Careers Last?
To answer that question, we'll have to establish a baseline: how long the average NFL career lasts.
The NFL Players Association pegs that number at 3.5 seasons. During the 2011 lockout, Commissioner Roger Goodell told a group of fans it's "closer to six years," assuming you're only counting players who are on the active roster from the beginning of their career. Goodell said it's more like nine years for first-round draft picks.
To find out when age robs top players of their superlative skills, though, we can't include players who never catch on in the NFL. Nor can we tie skills to draft status; many first-round picks fail and many late-round picks have long careers.
We turn to Pro Football Reference, whose Player-Season Finder tool lets us sort through players, seasons and statistics in nearly every imaginable way.
Let's set the starting point at 1978, the advent of the 16-game season and modern passing rules. By position, let's average out the career length of every player with at least five seasons' worth of starts and drop them into a box-and-whiskers chart:
For each position, the black dots at the top and bottom represent the high and low career length. The top black dot for the wide receiver group, for example, is Jerry Rice.
The orange boxes go from the lower quartile to the upper quartile of the group; half of all starters' career lengths land between the top and bottom of that box. The blue bands behind the yellow boxes represent the overall average for each position, which is written out in black numerals.
The first thing that stands out is just how similar the overall averages are. Other than the quarterbacks, who averaged 12.08 seasons, every other position's average career is about 10 and a half seasons.
Beyond that, we see how compressed the quartiles and upper bounds are for the running backs, wide receivers and tight ends. Their averages are in line with the rest of the positions, but it's obviously much harder to succeed into your 30s at the so-called skill positions.
That said, the high lower quartile also proves that talented offensive playmakers will get every opportunity. If you're a starting-caliber skill player, it's just as hard to have a short career as an exceptionally long one.
We tend to think of offensive linemen as having very long careers. You never hear draft analysts say "draft him and forget about his position for 10 years" unless they're talking about an offensive lineman.
Yet offensive linemen are tied with defensive backs for the lowest lower quartile in the group. It seems odd, but 25 percent of offensive linemen good enough to start 80 games don't make it past their eighth season.
Now we know how long the careers of NFL starters at every position last. How—and when—do they start to diminish?
Breaking Down Production Over Time
There are a million ways to judge production, but only one gives us a one-number figure that compares across positions, seasons and even decades: Pro Football Reference's Approximate Value.
As explained in the series of posts that link takes you to, AV is one back-of-the-napkin number for a player's total production over a season, adjusted by their share of their team's production. These numbers aren't super precise, just a good rough guess of how productive and valuable a player was in any given season.
For each of the position groups, we can break down average AV for rookies, second-year players, third-year players and so on, giving us a picture of how players at certain positions tend to develop and decline.
Again, let's limit the sample player-seasons to 1978 and after, assuring apples-to-apples season lengths and similar offensive rules. The sets will be limited to players-seasons with at least 14 starts (and qualifying levels of attempts, the ones PFR uses for their rate stat minimums).
For some of the positions with the most variance, I've done the same analysis but with age, as well as years of NFL experience.
Quarterbacks
The quarterback is the most important, most protected position on the field, and it shows. The average starting quarterback plays about two seasons more than the average player at any other position.
Let's look at how quarterbacks develop and decline:
This dramatically shows the late start and slow development of quarterbacks. See how there are zero 22-year-old quarterbacks who've started 14 NFL games since 1978? From 23 to 24, 24 to 25 and 25 to 26, there was a massive leap in understanding with each generation.
At age 25, quarterbacks hit a long plateau; the number of them who start 14-plus games from age 25 to 30 is almost unchanged. The curve stays quite flat on the back end; quarterbacks good enough to be perennial starters have little trouble staying employed.
Is their performance that consistent? Let's check out their average Approximate Values:
There are a few very interesting things going on here. First, an across-the-board jump from year one to year two; quarterbacks who start both their rookie and sophomore seasons put up a significantly higher peak, average and low AV in their second season.
That low value continues to jump up and down around the number five for most of the rest of the chart; the weird dip in year five is due to an outlier, Ron Jaworski's 1978. He started every game, but produced an AV of only one; the next-lowest value for a fifth-year starter was four.
Peak AV climbs very steadily from year three to year eight; the best quarterbacks get steadily better, even as the average and low values stay flat.
At year 10, there's a significant drop-off in peak AV, then a steady decline to year 15. The average, however, begins to trend upward as the poorer starters stop playing. The elites aren't producing like elites anymore, but they're still very good and make up the majority of quarterbacks with careers that long.
At year 16, it dwindles down to just a handful of quarterbacks, so the peak drops sharply and the floor rises too. The last data point is just Favre being Favre.
What if we look at the same values, but broken down by age? Is there a magic age when quarterbacks get worse?
This chart is a lot more volatile. The eye is drawn to the big dip in peak AV at age 29; this appears to just be a weird coincidence and not part of a larger trend (it's surrounded by very high AV values). Look at the jump from age 36 to age 37, though: High, average and low AV all take a big jump up—and then a huge dip. By 40, everyone but Favre is gone.
Running Backs
Running backs, in many ways, are the opposite of quarterbacks. They have much shorter careers, and they—if you'll forgive the joke—hit the ground running:
To qualify for this chart, backs had to start 14-plus games and rack up 100 or more carries on the season. That's Pro Football Reference's minimum number to qualify for rate stats.
As rookies, most running backs good enough to start are about as good as they're ever going to get. The top rookie backs are legitimately great, the floor is quite high and the average is right in line with where it'll be for the first seven seasons or so.
From the second year to the fourth year, a gap opens up between the haves and have-nots; the floor declines while the peak climbs. Maximum AV is reached at 26 and stays very high for the next few seasons.
In the eighth season, the high and low hold steady while the average declines; I presume this is because backs are starting to fade and dwindle. In the ninth year, a big jump in the floor and average confirms the poorest starters are gone and only the best producers remain.
Even the elites don't have long after that, though. The top AV value drops like a rock from the ninth year through the 14th, and the average and floor seesaw underneath it. The volatility there comes from the rapid drop-off of qualifying backs:
Look at the slow, steady climb of tailbacks who qualify from ages 21 through 25, then the quick, straight drop-off from the high of 27 down to 34. Though we think of quarterback as a "development" position, once quarterbacks have a few years' experience, they're either starters or out.
Running backs not talented enough to start right away, though, spend years getting stronger and waiting for their opportunity. It's too bad that by the time the most backs are starting (age 27), their skills are about to evaporate.
Wide Receivers
We think of receivers as being volatile, but their performance chart is actually one of the most sane and stable:
The eerily flat floor, I suspect, is partly due to the minimum qualifications of 14-plus games started and 30 receptions. That said, besides a small jump from year one to year two, the peak and average AV for receivers is basically just as flat.
From year two to year 10, the typical production of starting receivers basically doesn't change. There's an upward trend in the peak AVs, but that's it.
Year 10 begins a steep, steady decline in peak AV and a rise in average AV. This is the same effect we've seen before: Mediocre starters are stop playing, and the remaining elites are showing their age.
From Year 14 on, the small sample size starts making things squirrely. Also, there's the Jerry Rice Effect to contend with: He was so very good for so very long, the last three data points are all him.
If we go by age, the effect is even more pronounced:
Again, a big jump from year one to year two, then shockingly similar production until top AV peaks at 32 and begins a steep decline. Average AVs get a big bump as the decent starters fall off, but then they decline as well. After age 38, it's all Jerry Rice.
Let's take a quick look at the age distribution:
Remember the old saw about receivers taking a big jump in their third year? It's the truth. Even though the receivers good enough to start right away start out at nearly great and climb from there, there's a massive jump in qualifiers from year one to year two, and then from year two to year three.
The ensuing decline is much more gradual with receivers than backs.
Tight Ends
Other than running backs, tight ends have the most brutal performance chart:
Just like receivers, tight ends have a big jump in high and average AV from year one to year two, and then it's (mostly) flat.
Unlike receivers, though, the peak AV never gets any higher than year two's high-water mark, and there's a big decline in the average from year seven to year 10. By the 10th year, there's an across-the-board dip.
Then, even though high AV stays flat as a board, average and low AV steadily rise to meet it.
My theory here is that all tight ends begin to decline around year seven, but the two-way tight ends really start to go. At year 11, the only ones left are the elite pass-catchers, the ones who've never done much blocking. Their production pushes a dramatic rise in average from year 10 to year 15.
What about age?
This graph tells much the same story, though it's interesting to note that instead of a big jump from rookie season to second season, there's an across-the-board drop-off from age 22 to 23! The only explanation is that rookie tight ends drafted to start at age 22 are exceptionally athletic pass-catchers, so less-skilled 23-year-olds drag them down.
Here's the age distribution, brutish and short:
Note the peak qualifier year, age 26, comes earlier than any group we've looked at and tails off resolutely. There's no doubt that tight end is one of the most physically demanding positions.
Offensive Line
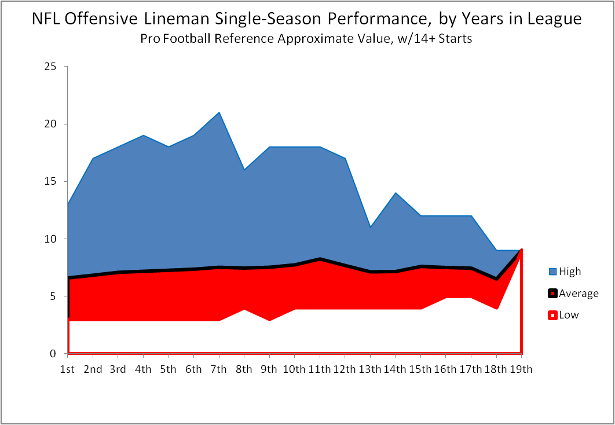
We expect offensive linemen to be rocks of consistent production, and they are:
The ruler-straight floor likely has to do with AV's limitations on measuring offensive linemen. If you started 14-plus games there's only so little you can be part of your team's production. Also, it's tempting to say the eerily flat average AV is due to the huge numbers of "offensive linemen" (remember, five start per team), not consistency.
Yet, peak AV moves the way we expect it: a big jump in the second year, a steady climb to year seven, a drop-off to a plateau from year eight to year 12 and then another big drop-off and decline.
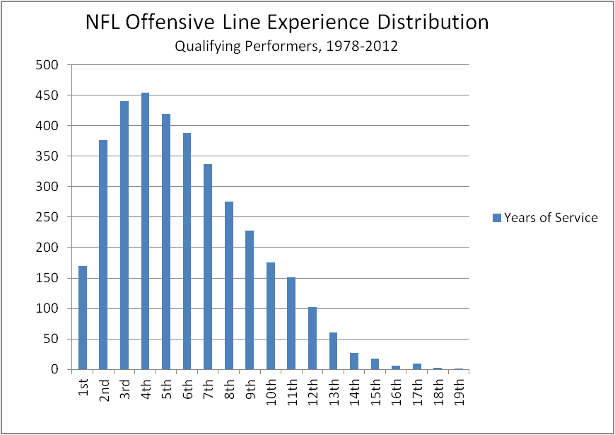
Meanwhile, average AV climbs slowly, resolutely upward, peaking in year 11 and then following the big drop-off to year 13. Let's check the experience distribution:
This is classic. A huge jump in qualifying starters from year one to year two, a peak at year four and then an almost-spookily consistent year-over-year decrease in qualifiers until year 15.
As the year-by-year charts have been more useful (and we've charted the more-volatile skill position careers), we'll stop looking for a "magic age" and focus on years of service.
Defensive Line
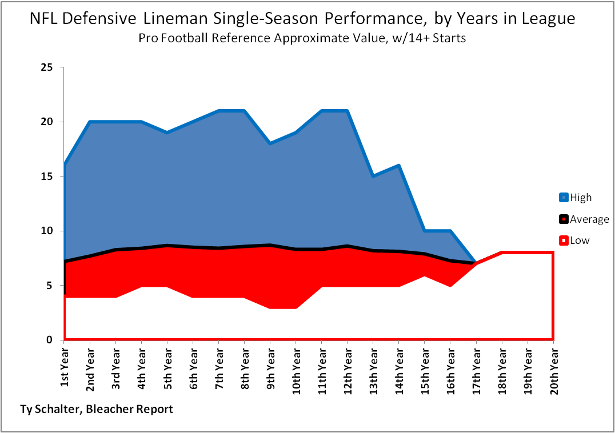
Though they're counterparts, you can see the increased role athleticism plays in defensive linemen: Peak AV gets higher and faster. There's less volatility in the peak and more volatility in the average, and the production drop-off from year 12 to year 15 is swift and shocking:
The extended line at the end is not one Jerry Rice, but two: Bruce Smith is responsible for the excellent year 17 and year 18 single data points, and Jim Marshall (whose consecutive-games record Brett Favre broke) was still going strong in his 19th and 20th seasons.
Only Marshall's last two years count, though, as they were 1978 and 1979!
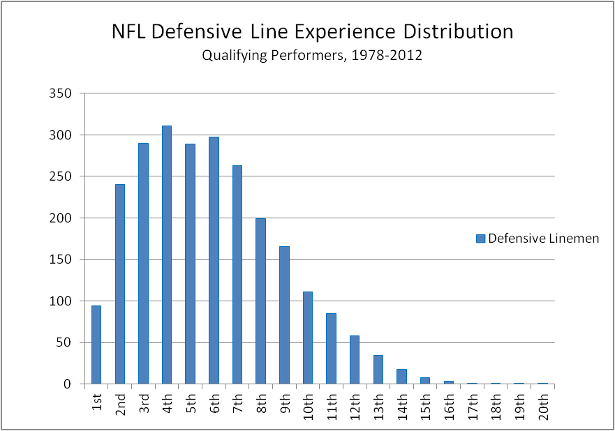
Let's look at the experience distribution of qualifiers:
The typically massive jump in starters from year one to year two is even more massive with defensive linemen. The greatest numbers of qualifiers are mostly flat from year three to year six, but years two and seven aren't far off the pace.
After a defensive lineman's seventh year in the NFL, his time is very, very short. Look at the huge drop-off in qualifying starters from year seven to year eight, and from year nine to year 10. The decline flattens for a while, as the best defensive linemen can stick around a very long time, but the quick development, long plateau and quick decline is obvious.
Linebackers
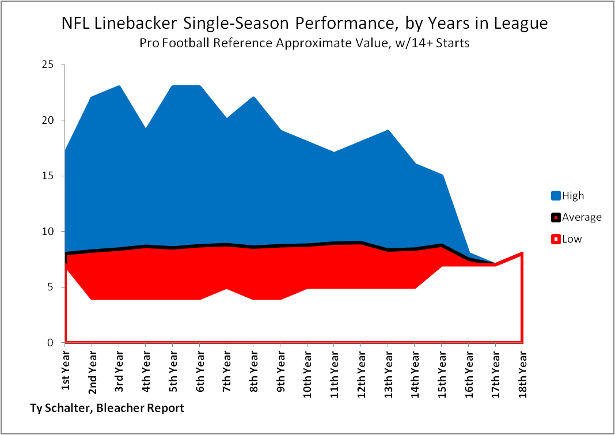
Linebackers have the most pronounced rookie effect of all the positions:
The floor is extremely high; talented linebackers who start as rookies will do very well right away. Even though that floor drops out as a mass of second-year players work their way into the lineup, the development is shocking: peak AV jumps from 17 (Lawrence Taylor) to 22 (Brian Urlacher).
The floor never gets lower than the second season, though. In fact, it slowly climbs for the duration of the chart. Like offensive linemen, the average AV builds slowly but very steadily throughout the first decade of a linebacker's career.
Peak AV is a little odd, though. In the midst of a fairly flat plateau from year two to year eight, there are two big dips at year four and year seven. Year eight's up-tick starts a three-year decline in peak AV, which oddly reverses course for two years before the bottom falls out in year 15.
Linebackers' lone warrior for year 17 and 18? Clay Matthews.
No, not the guy with the Fathead commercial. His dad.
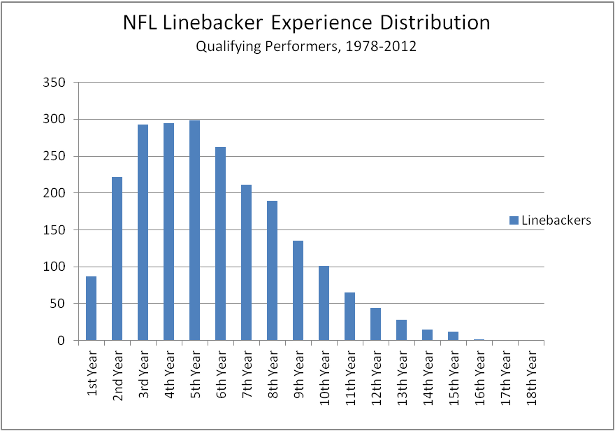
What about experience distribution?
We see a second-to-third year qualifier jump almost as big as the defensive linemen's and a very early peak in year three, which stays very flat for two more seasons. Essentially, if a linebacker isn't starting by year three, he probably never will.
The steady decline in qualifying linebackers after year five, we see, is much more gradual than the brick wall linemen hit.
Defensive Backs
Finally, we have the defensive backs:
Though they have a reputation for being mercurial, they actually have the most dependable, consistent production of any position group. The average AV, incredibly, rises consistently from the first year to the 16th!
The second-highest peak AV any defensive back has recorded came from a rookie: Patrick Peterson's 21 in 2011. Even if we discard it for being inflated by return touchdowns, Ronnie Lott was hot on Peterson's heels with 18.
So, as we can see, top defensive backs produce like top running backs immediately.
From the third year on, peak AV slowly, inexorably declines (save for a massive drop-off and bounce-back between years 12 and 14), while the floor stays flat and the average builds.
What about participation?
Turns out the defensive pattern holds here, too: a few excellent rookie starters, an enormous jump in second-year starters and a peak at year three. Unlike linebackers, though, year three doesn't begin a plateau, it's an actual peak. After year three, the number of defensive backs who start 14-plus games declines quite steadily.
Conclusion
There's no "age of doom" or "season of doom" for NFL players.
From one position to another, there are wildly different career development and production profiles. Even then, there are exceptions to every rule. One or two players at each position have broken all the rules and played at a high level into and beyond the high teens.
Across the board, though, we see that those players good enough to start for five years tend to play about 10 years, and even the best and hardiest lose an obvious step or two after 12 years.
Keep those facts in mind if you're an NFL team with a key veteran going into a contract year—or a diehard fan in the market for a new jersey.


