- Joined
- Jul 21, 2013
- Messages
- 11,735
http://ramsinperspective.com/2015/10/05/rams-cardinals-key-stats-analysis-week-4/
Rams-Cardinals: Key Stats Analysis – Week 4
October 5, 2015 By Frank "Dubs" Dobozy

The Jekyll and Hyde Rams came up big on Sunday, excelling in all three facets of the game on the way to upsetting the favored and previously undefeated Arizona Cardinals 24-22. Winning teams produce winning stats. The Rams produced winning stats across the board against the Cardinals. They’re sitting at 2-0 in the NFC West and 2-2 overall.
Sometimes you just have to go for the ride when you’re a Rams fan. Maddening inconsistency. They come out and defeat a pair of Super Bowl contenders (Seattle and Arizona) and then in the same 4-game span put up a pair of clunkers against Washington and Pittsburgh. The offense was the main culprit in the two losses. The Rams scored 58 points against two tough defenses (Seattle and Arizona), but could only muster 16 points against a pair of average defenses (Washington and Pittsburgh).
Throughout the 2015 season, I’ll be tracking five key team statistical measures, and their affect on the outcome of every Rams game: Turnover Differential, Big Play Differential, Points Per Drive Differential, Team Penalty Yards Differential, and the score of the game at half-time. When combined, Turnover Differential and Big Play Differential creates a statistic commonly referred to as “Toxic Differential”.
Why were these 5 particular metrics selected for tracking throughout the 2015 season? Turnovers and Big Plays have proven to be influential in determining the outcome of a game. There’s a historically strong correlation between Points Per Drive Differential and a teams regular season record. The score at half-time and Team Penalty Yards Differential were selected specifically with the Rams in mind. There appears to be a strong correlation between the score at half-time and the Rams’ win/loss record. The Rams – under Jeff Fisher – have been among the league leaders in penalties, to their detriment.
St. Louis Rams 2014 Statistical Records
2014 Key Stats Analysis
Points per Drive Differential: 6 games positive – Record 5-1. 10 games negative – Record 1-9.
Turnover Differential: 3 games positive – Record 3-0. 6 games negative – Record 0-6. 7 games even – Record 3-4. 4 games without a turnover – Record 4-0.
Big Play Differential: 6 games positive – Record 3-3. 10 games negative – Record 3-7.
Penalty Yards Differential: 4 games positive – Record 3-1. 12 games negative – Record 3-9.
Score At Half-Time – The Rams were leading or tied at the half in 11 games last season. The Rams’ record was 6-5 in those games. The Rams lost all 5 games where they were behind at the half. In fact, the Rams haven’t won a game in the past two seasons unless they were tied or winning at half-time.
Turnover Differential
It’s a widely held belief that winning the turnover battle is important to a teams success on the field. The Rams finished with 6 wins in 2014. The team had a positive turnover differential in 3 of those wins, and a zero differential in the other 3 victories. Overall, the Rams finished 19’th in Turnover Differential (minus -2) last season.
The Super Bowl Champion New England Patriots finished 3rd in Turnover Differential (plus +12) while the NFC Champion Seattle Seahawks finished 4th (plus +10). Over the 2014 NFL season, the average Turnover Differential among NFL teams was zero (0). The top 5 NFL teams averaged a Turnover Differential of 11.2, while the bottom 5 teams averaged a Turnover Differential of -12.2.
Turnovers played a critical role Sunday against the Arizona Cardinals. The Rams held onto to the ball with aplomb and did not turn it over once. The Rams were the beneficiaries of three turnovers allowed by the Cardinals. For the game, the Rams were a plus +3 in Turnover Differential.
The Rams forced a fumble on the opening kickoff, allowing the Rams to score an easy 7 points in the first two minutes of the game. A Janoris Jenkins interception in the 2nd quarter stopped a Cardinals drive and allowed the Rams to march down the field and score a field goal. A Larry Fitzgerald fumble in the third quarter allowed the Rams to march down the field 58 yards for a touchdown on the ensuing drive.
4 weeks into the season, the Rams rank 11th in the league in Turnover Differential (plus +2).
Team Turnover Differential Statistics
Team Takeaways Giveaways Turnover Differential
Team Penalty Yards Differential
In 2014, the Rams were the 3rd most-penalized team in the NFL, averaging 7.7 Team Penalties Per Game (the same average as 2013). The Rams led the league in most penalty yards (1139), and were 30’th in the league in Team Penalty Yards Differential (-257).
For a team that would like to keep the ball on the ground, penalties all too often force that team into a passing situation. Penalties kill drives, contribute to bad field position and can change momentum in a game. In an average NFL game, the officials will call between 12-14 penalties per game (both teams combined). The Rams’ goals should be to have no more than 6 penalties per game, plus a positive Team Penalty Yards Differential.
The Rams were flagged 7 times for 66 yards in the game against Arizona. The Cardinals played a highly disciplined game, drawing only 3 penalties for 20 yards. The Rams were a minus -46 yards in Team Penalty Yards Differential for the game.
For the season, the Rams rank 20th in the league in Team Penalty Yards Differential. Although penalties are still an issue, the Rams are no longer among the two or three worst teams in this statistic.
Team Penalty Yards Differential
Big Play Differential
Big Play Differential is the difference between the number of big plays – running plays of 10+ yards plus passing plays of 25+ yards – an offense creates, and the number of big plays a defense allows. How important are big plays to a teams offense/defense? Last season, NFL teams averaged 0.8 points per drive without a big play, and 3.9 points per drive with at least one of them. The higher the big play +/- the better as this shows the team more often generates big plays than gives them up.
In the game against Arizona, the Rams had 6 Rushing Big Plays and 1 Passing Big Play, while allowing 6 Big Plays, for a Big Play Differential of plus +1 for the game. Rams RB Todd Gurley basically took over the game in the 4th quarter:
With a quarter of the season completed, the Rams rank 10th in Big Play Differential (plus +3).
Team Big Plays Statistics (link)
Points Per Drive Differential
Points Per Drive Differential is a derivative of Points Scored/Allowed. It measures the number of points generated/allowed on an average drive. 13 teams reached the playoffs/won 10 games in 2014. 10 of them finished in the top dozen in Points Per Drive Differential.
Successful teams with winning records are normally the most efficient – both offensively and defensively – and consistently generate positive PPD Differentials. The higher the points per drive the better, and in theory the highest this statistic could be is 8, which would occur if a team scored a touchdown AND a two point conversion every time they have the ball.
In Sunday’s tilt against Arizona, both the Rams and Cardinals had 12 drives. The Rams scored 24 points on their 12 drives (a 2.0 PPD Differential), while the Cardinals scored 22 points on their 12 drives (a 1.83 PPD Differential). That’s how close this game was.
For the season, the Rams rank 22nd in Points Per Drive Differential (minus -0.34). The lower ranking is attributable to the Rams’ offensive struggles in their games against Pittsburgh and Washington.
find points per drive stats on link
Score At Half-Time
There was a semblance of Jekyll (the first half) and Hyde (the second half) in most of the Rams’ games last season. The teams’ point differential in the first half of games: plus 58. In the second half of games: minus 88. The Rams were leading or tied at the half in 11 games last season. The Rams’ record was 6-5 in those games. The Rams lost all 5 games where they were behind at the half. In fact, the Rams haven’t won a game in the past two seasons unless they were tied or winning at half-time.
The Rams held true to form in the game against the Cardinals. The Rams went into the locker room with a slim 10-9 lead. In a tough defensive struggle and all-around slugfest, the Rams hung on in the second half and prevailed 24-22. In an interesting reversal of form, the Rams (in contrast to 2014) are playing better football in the 2nd half of games when compared to the first half of games. In four games this season, the Rams have outscored their opponents 51-44 in the second half, while being outscored 45-23 in the first half.
(read entire article on link above)
As noted earlier, winning teams produce winning statistics. The game against Arizona was no exception, as the Rams delivered a number of positives in the statistics being tracked for the 2015 season.
Pro Football Focus Player Grades
Here are the top takeaways and highest-graded players from Sunday’s Rams-Cardinals game:
St Louis Rams
– After getting eased into his first regular season action last week, RB Todd Gurley (-1.6) saw a big increase in touches against the Cardinals with 19 carries. He gained north of 140 yards while breaking a couple of tackles and consistently making good cuts on the Rams’ zone runs, although he did have an almost-costly fumble inside his own 15-yard line, which dropped his overall grade substantially. The Rams offensive line also deserves credit for his performance, after a much-improved blocking effort this week. Gurley gained more yards after contact (10) than net yards (9) against Pittsburgh, but on Sunday, more than half of his rushing yards came before contact.
– Overall, a very clean, solid outing for Nick Foles (+2.6), who handled pressure decently and protected the ball while delivering a few big-time throws when he ventured more than 10 yards from the line of scrimmage. One of those was at 5:53 of the third quarter, when he connected with Stedman Bailey (+1.3) on a corner route in the end zone to extend the Rams’ lead to eight. Almost no negatives to note, outside of a couple of misses and his occasional tendency to drift in the pocket and screw up his blockers’ leverage.
– This was the third straight game that DT Nick Fairley (+1.4) played less than 20 snaps, but he continues to grade positively in limited playing time, with this game putting him at +6.0 overall on the season. On his second snap, Fairley faced little resistance from center Lyle Sendlein (-2.5) on his way to pressuring Carson Palmer (+2.2). And at 4:59 of the third quarter, he made a similar play, beating guard Jonathan Cooper (-1.5) outside to draw a holding penalty.
Top Performers
P Johnny Hekker (+4.8)
WR Tavon Austin (+3.1)
QB Nick Foles (+2.6)
DT Aaron Donald (+2.3)
DE Robert Quinn (+1.4)
DT Nick Fairley (+1.4)
Arizona Cardinals
– DE Calais Campbell (+5.8) turned in his highest grade of the season, with a dominating performance on the interior as he collected three combined pressures and eight defensive stops, most of them coming against either LG Jamon Brown (-5.0) or LT Greg Robinson (-2.4). Take a look at 4:08 of the first quarter and 15:00 of the third for a pair of examples. It was much of the same for the rest of the game.
– Not bad for LG Mike Iupati (+1.5) in his first regular season action with the Cardinals. He had some rough moments against Aaron Donald, including at both 11:31 and 1:24 of the second quarter, but otherwise looked similar to the player we saw in San Francisco, with more than 45 clean snaps in pass protection and some good blocks at the second level in the run game.
– This was a winnable game for the Cardinals, who moved the ball fairly well, but consistently stalled in the red zone and settled for field goals. QB Carson Palmer had several costly misses, including an underthrow that resulted in an interception at 6:59 of the second quarter, and an overthrow of an open receiver on fourth down on the team’s final offensive play. Otherwise, he had a decent game, especially when given a clean pocket, going 13-for-18 on intermediate throws. And he saw little help from his receivers with two drops on third down in the red zone that would have resulted in a first down and touchdown if caught.
Top Performers
DE Calais Campbell (+5.8)
QB Carson Palmer (+2.2)
CB Patrick Peterson (+2.0)
CB Tyrann Mathieu (+1.6)
LG Mike Iupati (+1.5)
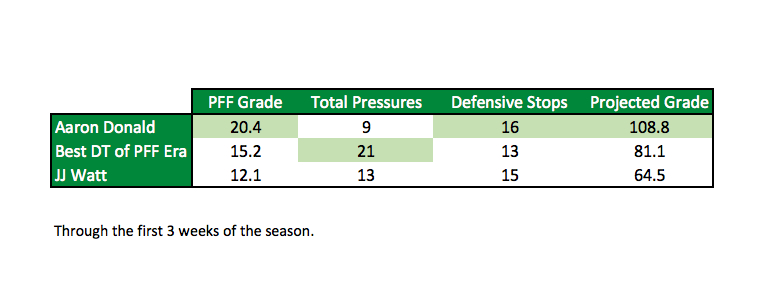
Could Aaron Donald be the next J.J. Watt? Pro Football Focus and Sam Monson explain how Aaron Donald is on a near-record pace.
Always an interesting read....lil free time, so I posted...click link to see the stats...
Rams-Cardinals: Key Stats Analysis – Week 4
October 5, 2015 By Frank "Dubs" Dobozy
The Jekyll and Hyde Rams came up big on Sunday, excelling in all three facets of the game on the way to upsetting the favored and previously undefeated Arizona Cardinals 24-22. Winning teams produce winning stats. The Rams produced winning stats across the board against the Cardinals. They’re sitting at 2-0 in the NFC West and 2-2 overall.
Sometimes you just have to go for the ride when you’re a Rams fan. Maddening inconsistency. They come out and defeat a pair of Super Bowl contenders (Seattle and Arizona) and then in the same 4-game span put up a pair of clunkers against Washington and Pittsburgh. The offense was the main culprit in the two losses. The Rams scored 58 points against two tough defenses (Seattle and Arizona), but could only muster 16 points against a pair of average defenses (Washington and Pittsburgh).
Throughout the 2015 season, I’ll be tracking five key team statistical measures, and their affect on the outcome of every Rams game: Turnover Differential, Big Play Differential, Points Per Drive Differential, Team Penalty Yards Differential, and the score of the game at half-time. When combined, Turnover Differential and Big Play Differential creates a statistic commonly referred to as “Toxic Differential”.
Why were these 5 particular metrics selected for tracking throughout the 2015 season? Turnovers and Big Plays have proven to be influential in determining the outcome of a game. There’s a historically strong correlation between Points Per Drive Differential and a teams regular season record. The score at half-time and Team Penalty Yards Differential were selected specifically with the Rams in mind. There appears to be a strong correlation between the score at half-time and the Rams’ win/loss record. The Rams – under Jeff Fisher – have been among the league leaders in penalties, to their detriment.
St. Louis Rams 2014 Statistical Records
2014 Key Stats Analysis
Points per Drive Differential: 6 games positive – Record 5-1. 10 games negative – Record 1-9.
Turnover Differential: 3 games positive – Record 3-0. 6 games negative – Record 0-6. 7 games even – Record 3-4. 4 games without a turnover – Record 4-0.
Big Play Differential: 6 games positive – Record 3-3. 10 games negative – Record 3-7.
Penalty Yards Differential: 4 games positive – Record 3-1. 12 games negative – Record 3-9.
Score At Half-Time – The Rams were leading or tied at the half in 11 games last season. The Rams’ record was 6-5 in those games. The Rams lost all 5 games where they were behind at the half. In fact, the Rams haven’t won a game in the past two seasons unless they were tied or winning at half-time.
Turnover Differential
It’s a widely held belief that winning the turnover battle is important to a teams success on the field. The Rams finished with 6 wins in 2014. The team had a positive turnover differential in 3 of those wins, and a zero differential in the other 3 victories. Overall, the Rams finished 19’th in Turnover Differential (minus -2) last season.
The Super Bowl Champion New England Patriots finished 3rd in Turnover Differential (plus +12) while the NFC Champion Seattle Seahawks finished 4th (plus +10). Over the 2014 NFL season, the average Turnover Differential among NFL teams was zero (0). The top 5 NFL teams averaged a Turnover Differential of 11.2, while the bottom 5 teams averaged a Turnover Differential of -12.2.
Turnovers played a critical role Sunday against the Arizona Cardinals. The Rams held onto to the ball with aplomb and did not turn it over once. The Rams were the beneficiaries of three turnovers allowed by the Cardinals. For the game, the Rams were a plus +3 in Turnover Differential.
The Rams forced a fumble on the opening kickoff, allowing the Rams to score an easy 7 points in the first two minutes of the game. A Janoris Jenkins interception in the 2nd quarter stopped a Cardinals drive and allowed the Rams to march down the field and score a field goal. A Larry Fitzgerald fumble in the third quarter allowed the Rams to march down the field 58 yards for a touchdown on the ensuing drive.
4 weeks into the season, the Rams rank 11th in the league in Turnover Differential (plus +2).
Team Turnover Differential Statistics
Team Takeaways Giveaways Turnover Differential
Team Penalty Yards Differential
In 2014, the Rams were the 3rd most-penalized team in the NFL, averaging 7.7 Team Penalties Per Game (the same average as 2013). The Rams led the league in most penalty yards (1139), and were 30’th in the league in Team Penalty Yards Differential (-257).
For a team that would like to keep the ball on the ground, penalties all too often force that team into a passing situation. Penalties kill drives, contribute to bad field position and can change momentum in a game. In an average NFL game, the officials will call between 12-14 penalties per game (both teams combined). The Rams’ goals should be to have no more than 6 penalties per game, plus a positive Team Penalty Yards Differential.
The Rams were flagged 7 times for 66 yards in the game against Arizona. The Cardinals played a highly disciplined game, drawing only 3 penalties for 20 yards. The Rams were a minus -46 yards in Team Penalty Yards Differential for the game.
For the season, the Rams rank 20th in the league in Team Penalty Yards Differential. Although penalties are still an issue, the Rams are no longer among the two or three worst teams in this statistic.
Team Penalty Yards Differential
Big Play Differential
Big Play Differential is the difference between the number of big plays – running plays of 10+ yards plus passing plays of 25+ yards – an offense creates, and the number of big plays a defense allows. How important are big plays to a teams offense/defense? Last season, NFL teams averaged 0.8 points per drive without a big play, and 3.9 points per drive with at least one of them. The higher the big play +/- the better as this shows the team more often generates big plays than gives them up.
In the game against Arizona, the Rams had 6 Rushing Big Plays and 1 Passing Big Play, while allowing 6 Big Plays, for a Big Play Differential of plus +1 for the game. Rams RB Todd Gurley basically took over the game in the 4th quarter:
With a quarter of the season completed, the Rams rank 10th in Big Play Differential (plus +3).
Team Big Plays Statistics (link)
Points Per Drive Differential
Points Per Drive Differential is a derivative of Points Scored/Allowed. It measures the number of points generated/allowed on an average drive. 13 teams reached the playoffs/won 10 games in 2014. 10 of them finished in the top dozen in Points Per Drive Differential.
Successful teams with winning records are normally the most efficient – both offensively and defensively – and consistently generate positive PPD Differentials. The higher the points per drive the better, and in theory the highest this statistic could be is 8, which would occur if a team scored a touchdown AND a two point conversion every time they have the ball.
In Sunday’s tilt against Arizona, both the Rams and Cardinals had 12 drives. The Rams scored 24 points on their 12 drives (a 2.0 PPD Differential), while the Cardinals scored 22 points on their 12 drives (a 1.83 PPD Differential). That’s how close this game was.
For the season, the Rams rank 22nd in Points Per Drive Differential (minus -0.34). The lower ranking is attributable to the Rams’ offensive struggles in their games against Pittsburgh and Washington.
find points per drive stats on link
Score At Half-Time
There was a semblance of Jekyll (the first half) and Hyde (the second half) in most of the Rams’ games last season. The teams’ point differential in the first half of games: plus 58. In the second half of games: minus 88. The Rams were leading or tied at the half in 11 games last season. The Rams’ record was 6-5 in those games. The Rams lost all 5 games where they were behind at the half. In fact, the Rams haven’t won a game in the past two seasons unless they were tied or winning at half-time.
The Rams held true to form in the game against the Cardinals. The Rams went into the locker room with a slim 10-9 lead. In a tough defensive struggle and all-around slugfest, the Rams hung on in the second half and prevailed 24-22. In an interesting reversal of form, the Rams (in contrast to 2014) are playing better football in the 2nd half of games when compared to the first half of games. In four games this season, the Rams have outscored their opponents 51-44 in the second half, while being outscored 45-23 in the first half.
(read entire article on link above)
As noted earlier, winning teams produce winning statistics. The game against Arizona was no exception, as the Rams delivered a number of positives in the statistics being tracked for the 2015 season.
Pro Football Focus Player Grades
Here are the top takeaways and highest-graded players from Sunday’s Rams-Cardinals game:
St Louis Rams
– After getting eased into his first regular season action last week, RB Todd Gurley (-1.6) saw a big increase in touches against the Cardinals with 19 carries. He gained north of 140 yards while breaking a couple of tackles and consistently making good cuts on the Rams’ zone runs, although he did have an almost-costly fumble inside his own 15-yard line, which dropped his overall grade substantially. The Rams offensive line also deserves credit for his performance, after a much-improved blocking effort this week. Gurley gained more yards after contact (10) than net yards (9) against Pittsburgh, but on Sunday, more than half of his rushing yards came before contact.
– Overall, a very clean, solid outing for Nick Foles (+2.6), who handled pressure decently and protected the ball while delivering a few big-time throws when he ventured more than 10 yards from the line of scrimmage. One of those was at 5:53 of the third quarter, when he connected with Stedman Bailey (+1.3) on a corner route in the end zone to extend the Rams’ lead to eight. Almost no negatives to note, outside of a couple of misses and his occasional tendency to drift in the pocket and screw up his blockers’ leverage.
– This was the third straight game that DT Nick Fairley (+1.4) played less than 20 snaps, but he continues to grade positively in limited playing time, with this game putting him at +6.0 overall on the season. On his second snap, Fairley faced little resistance from center Lyle Sendlein (-2.5) on his way to pressuring Carson Palmer (+2.2). And at 4:59 of the third quarter, he made a similar play, beating guard Jonathan Cooper (-1.5) outside to draw a holding penalty.
Top Performers
P Johnny Hekker (+4.8)
WR Tavon Austin (+3.1)
QB Nick Foles (+2.6)
DT Aaron Donald (+2.3)
DE Robert Quinn (+1.4)
DT Nick Fairley (+1.4)
Arizona Cardinals
– DE Calais Campbell (+5.8) turned in his highest grade of the season, with a dominating performance on the interior as he collected three combined pressures and eight defensive stops, most of them coming against either LG Jamon Brown (-5.0) or LT Greg Robinson (-2.4). Take a look at 4:08 of the first quarter and 15:00 of the third for a pair of examples. It was much of the same for the rest of the game.
– Not bad for LG Mike Iupati (+1.5) in his first regular season action with the Cardinals. He had some rough moments against Aaron Donald, including at both 11:31 and 1:24 of the second quarter, but otherwise looked similar to the player we saw in San Francisco, with more than 45 clean snaps in pass protection and some good blocks at the second level in the run game.
– This was a winnable game for the Cardinals, who moved the ball fairly well, but consistently stalled in the red zone and settled for field goals. QB Carson Palmer had several costly misses, including an underthrow that resulted in an interception at 6:59 of the second quarter, and an overthrow of an open receiver on fourth down on the team’s final offensive play. Otherwise, he had a decent game, especially when given a clean pocket, going 13-for-18 on intermediate throws. And he saw little help from his receivers with two drops on third down in the red zone that would have resulted in a first down and touchdown if caught.
Top Performers
DE Calais Campbell (+5.8)
QB Carson Palmer (+2.2)
CB Patrick Peterson (+2.0)
CB Tyrann Mathieu (+1.6)
LG Mike Iupati (+1.5)
Could Aaron Donald be the next J.J. Watt? Pro Football Focus and Sam Monson explain how Aaron Donald is on a near-record pace.
Always an interesting read....lil free time, so I posted...click link to see the stats...